Trips analyzed in my latest project: 94,689

Kumar Mehul, Data Analyst. SQL, Python, Tableau. From raw data to decisions that stick.

94,689
CitiBike trips cleaned and analyzed
~8,000
foundation records audited
~8.9M
records in a dimensional warehouse
17
heterogeneous sources integrated

About

I am a Data Analyst with an MS in Information Systems from Northeastern University, Boston, and hands-on professional experience in data operations and reporting. My work covers the full analysis cycle - from sourcing and cleaning raw data to building the reporting layer that teams use to make decisions. I work primarily in SQL, Python, and Tableau, with additional experience in Power BI, Alteryx, and Talend across ETL and dimensional modeling workflows.

Experience

Grants intelligence, end to end. Building, auditing, and enriching a grants team's dataset of 8,000 foundations.

Data Analyst

Rebecca Everlene Trust Company · Chicago, USA (Remote)

Oct 2024 - May 2025

Built a grants intelligence dataset from IRS 990 filings and foundation websites, then audited, gap-analyzed, and enriched it into submission-ready grant packages for the team.

~8,000
records audited for structural integrity
~6,300
foundations segmented across a 12-month grant pipeline
~80%
of assigned foundations with packages ready before deadlines
  • Extracted IRS 990 and foundation website data in Google Sheets for about 2,000 of the team's 8,000 organization records.
  • Audited the team's full 8,000-record dataset in Google Sheets for structural integrity and formatting consistency, resolving field-level inconsistencies across every record.
  • Ran a structured gap analysis with a resolution log across multiple review cycles, focusing follow-up on recoverable gaps.
  • Segmented foundations by application deadline into Monday.com boards alongside the grants team, enabling prioritization by application window.
Projects

From raw data to decisions. Three end-to-end analyses across mobility, entertainment, and food safety data.

Featured case study

Jersey City Last-Mile Mobility Analysis

Which CitiBike stations run out of bikes, when, and for whom? An analysis of 94,689 trips across Jersey City and Hoboken, from raw data to a rebalancing plan.

Jun 2026 - Jul 2026PostgreSQL · Python (pandas, matplotlib, seaborn) · Tableau

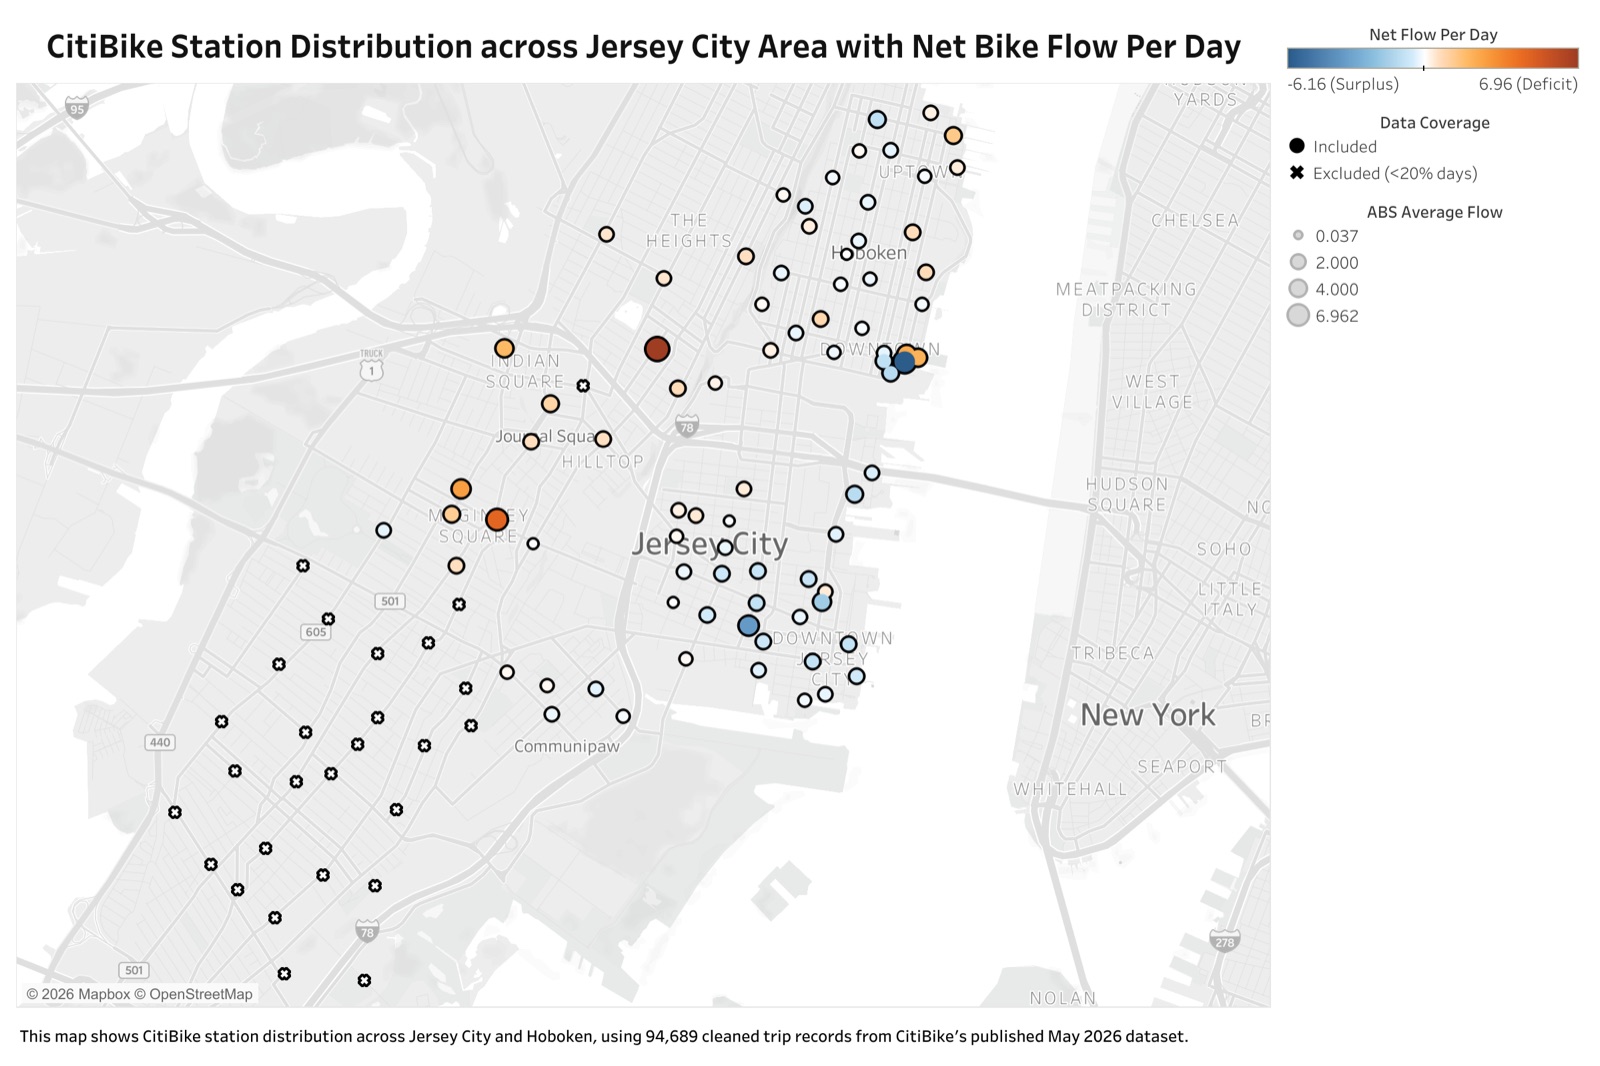
Tableau map of all 108 CitiBike stations in Jersey City and Hoboken, colored by daily net bike flow from surplus (blue) to deficit (orange) and sized by magnitude.
All 108 stations by average daily bike flow. Color shows direction (drain or surplus), size shows magnitude, and the 27 lower-volume stations use a separate marker. Open the live dashboard
94,689
verified trips
108
stations mapped
10
priority stations
17.8%
peak daily imbalance

The question

How do CitiBike usage patterns in the Jersey City area reveal opportunities to better serve commuter and recreational demand?

The approach

Cleaned 95,350 raw trips in pandas, removing 355 null records and 306 cross-system rides to leave 94,689. Built reusable PostgreSQL views for each station's daily bike flow and imbalance, and kept low-volume noise out of the rankings with a two-stage reliability filter (more than 25 daily rides on at least 6 of 31 days) that narrowed 108 stations to 84, then 81. Published a Tableau map of every station.

Finding 01

Members commute. Casual riders don't.

Members take short trips at high volume nearly all day, with peaks in the morning and evening. Casual riders ride longer and build to a single evening peak, with no morning spike at all.

Rides by hour of day

  • Members
  • Casual riders
Members peak twice, at 8am (5,577 rides) and 5pm (7,263); casual riders build to a single peak at 5pm (2,163). Source: Citi Bike System Data, May 2026.
View data
HourMembersCasual riders
12am625528
1am315322
2am212255
3am129193
4am214112
5am763209
6am2,183429
7am4,165714
8am5,577953
9am3,274773
10am3,221859
11am3,1771,000
12pm3,3521,164
1pm3,4811,280
2pm3,5051,367
3pm4,4261,643
4pm5,1501,810
5pm7,2632,163
6pm6,6032,143
7pm4,7641,700
8pm3,3801,340
9pm2,4471,066
10pm1,742890
11pm1,106702

Finding 02

Bike drain concentrates in one corridor.

Oakland Ave, McGinley Square, and Glenwood Ave lose the most bikes every day, and the draining stations cluster in a single Jersey City corridor. Surplus stations such as River St & Newark St and City Hall split evenly across both cities.

Average daily bike flow by station

  • Draining (more departures)
  • Surplus (more arrivals)
  1. Oakland Ave+6.96
  2. McGinley Square+4.66
  3. Glenwood Ave+2.80
  4. River St & 1 St+2.42
  5. South Waterfront Walkway - Sinatra Dr & 1 St+2.17
  6. Newport PATH−1.16
  7. Hoboken Terminal - Hudson St & Hudson Pl−1.23
  8. Washington St & Morgan St−1.82
  9. City Hall−3.70
  10. River St & Newark St−6.16
Departures minus arrivals, averaged over days with more than 25 rides at stations with at least 6 such days. Source: Citi Bike System Data, May 2026.
View data
StationBikes a dayImbalanceQualifying days
Oakland Ave+6.9617.8%26
McGinley Square+4.6610.8%29
Glenwood Ave+2.8017.0%10
River St & 1 St+2.426.5%31
South Waterfront Walkway - Sinatra Dr & 1 St+2.174.4%29
Newport PATH−1.162.7%31
Hoboken Terminal - Hudson St & Hudson Pl−1.233.4%31
Washington St & Morgan St−1.825.2%11
City Hall−3.706.1%30
River St & Newark St−6.165.2%31

The recommendation

Split rebalancing by city, not by operation type. Every draining and surplus station sorts cleanly into Jersey City or Hoboken, so one route per city covers the whole problem without cross-city travel. Shared transit hubs like Grove St PATH should be sized for peak-hour capacity, not all-day demand.

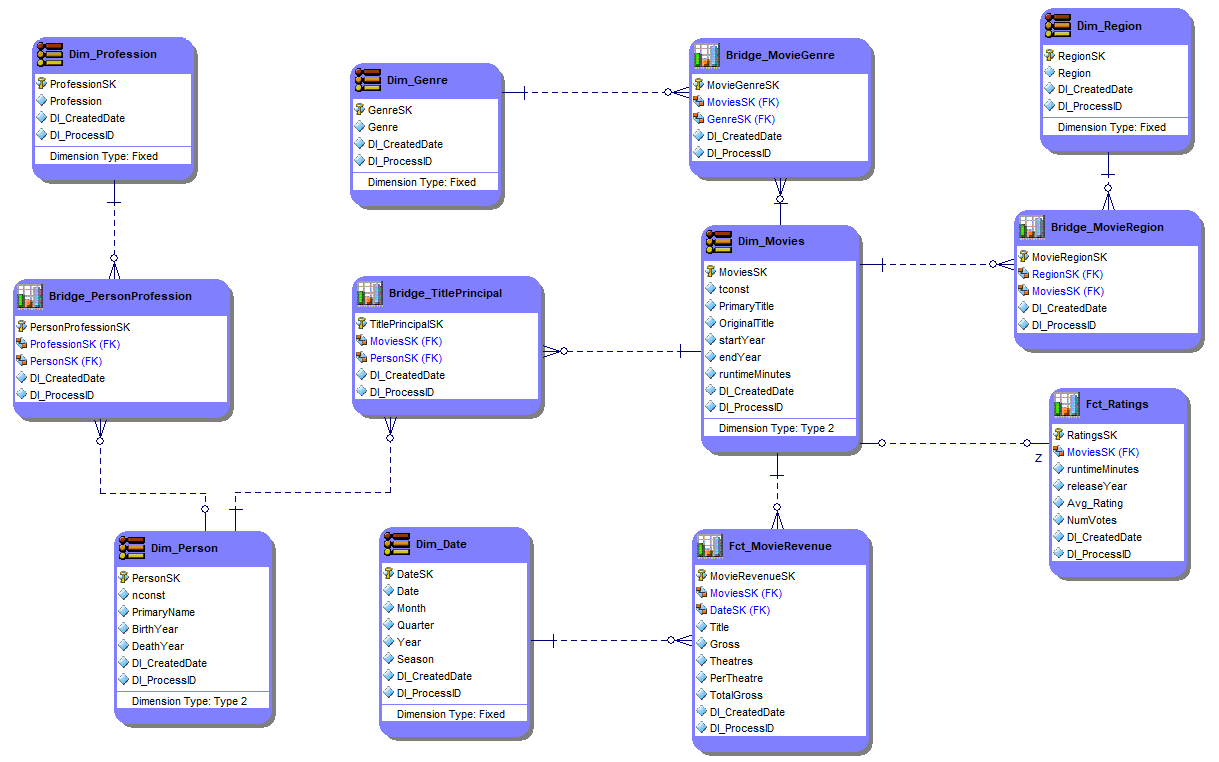
E/R Studio logical model of the IMDB warehouse with dimension, fact and bridge tables.
The 12-table dimensional model in E/R Studio: 6 dimensions, 2 fact tables, and 4 bridge tables.

Dec 2023 - Apr 2024

IMDB Movie Data Analysis

Alteryx · Talend · Tableau · Azure SQL · E/R Studio

Built Talend jobs to load about 1 million source records from 17 heterogeneous sources into a 12-table dimensional model on Azure SQL, expanding many-to-many relationships into a warehouse of about 8.9 million records. Designed the model in E/R Studio, profiled and validated all source data in Alteryx, and built Tableau dashboards covering genre ratings and revenue, multi-year output and rating trends, seasonal release performance, and regional release footprint.

  • ~1M source records
  • 17 sources
  • ~8.9M-record warehouse
  • 12 tables
View repository
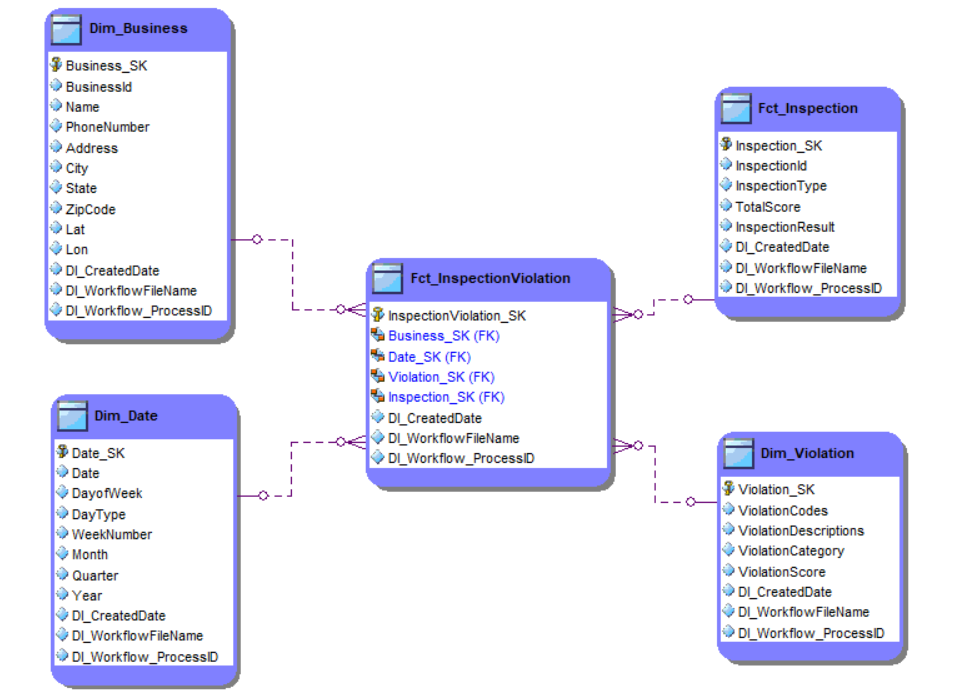
E/R Studio star schema with business, date and violation dimensions around inspection fact tables.
The 5-table star schema: 3 dimensions and 2 fact tables around inspections and violations.

Oct 2023 - Nov 2023

California Food Inspection Analysis

Alteryx · Talend · Tableau · Azure SQL · MySQL · E/R Studio

Built a compliance analytics system for Sonoma County food facility inspections. Designed a 5-table star schema, profiled and cleansed source data in Alteryx, loaded into Azure SQL via Talend, and built Tableau dashboards covering inspection trends, pass/fail analysis, violation category breakdowns, and geographic risk distribution.

  • 5-table star schema
  • Sonoma County
  • Tableau dashboards
View repository

Skills

The toolkit. What I use, and what I use it for.

Analytics & Visualization

  • Tableau
  • Power BI

Business intelligence · Dashboards · KPIs · Drill-downs · Ad-hoc analysis · Data storytelling

Languages

  • SQL
  • Python
  • pandas
  • matplotlib
  • seaborn

Data manipulation · Data cleaning · Querying · Exploratory data analysis

Data Preparation

  • Alteryx
  • Talend

ETL · Data profiling · Data transformation · Data integration · Data quality

Databases

  • PostgreSQL
  • SQL Server
  • Azure SQL
  • MySQL
  • E/R Studio

Relational databases · Dimensional modeling · Data warehousing · Data modeling

Education

Education.

  1. Master of Science in Information Systems

    Northeastern University, Boston, USA

    Sep 2022 - May 2024

  2. Bachelor of Technology in Information Technology

    SRM Institute of Science and Technology, Chennai, India

    Jul 2016 - May 2020

Contact

Get in Touch

Hiring an analyst, or sitting on data that needs answers? Tell me about it.
I read every message.